> ## Documentation Index
> Fetch the complete documentation index at: https://docs.ocular.dev/llms.txt
> Use this file to discover all available pages before exploring further.
# Salient features
> The capabilities that set Ocular apart from generic BI tools — purpose-built data models, prebuilt reports, and operator workflows for multi-channel commerce.
Ocular is a BI platform built specifically for multi-channel commerce. The features below are the ones that most directly differentiate it from a generic dashboard tool.
## Unified semantic layer
One place to ask questions of your commerce data. Every metric and dimension is defined once and used consistently across the P\&L, Marketing report, Cohorts, Chart Builder, and any custom dashboard.
"Net revenue", "sales channel", and "valid order" mean the same thing everywhere — across Shopify, Blinkit, Zepto, and every other connected source. The underlying infrastructure, ingestion pipeline, and storage stay invisible; you query the semantic layer, and that's it.
**Why this matters:** Most analytics tools force teams to assemble the truth from multiple dashboards, each with its own definition of "revenue" or "customer". Ocular's semantic layer *is* the truth — so cross-functional conversations stop being about whose number is right.
Full reference: **Data Dictionary**.
## Lakhs and crores number formatting
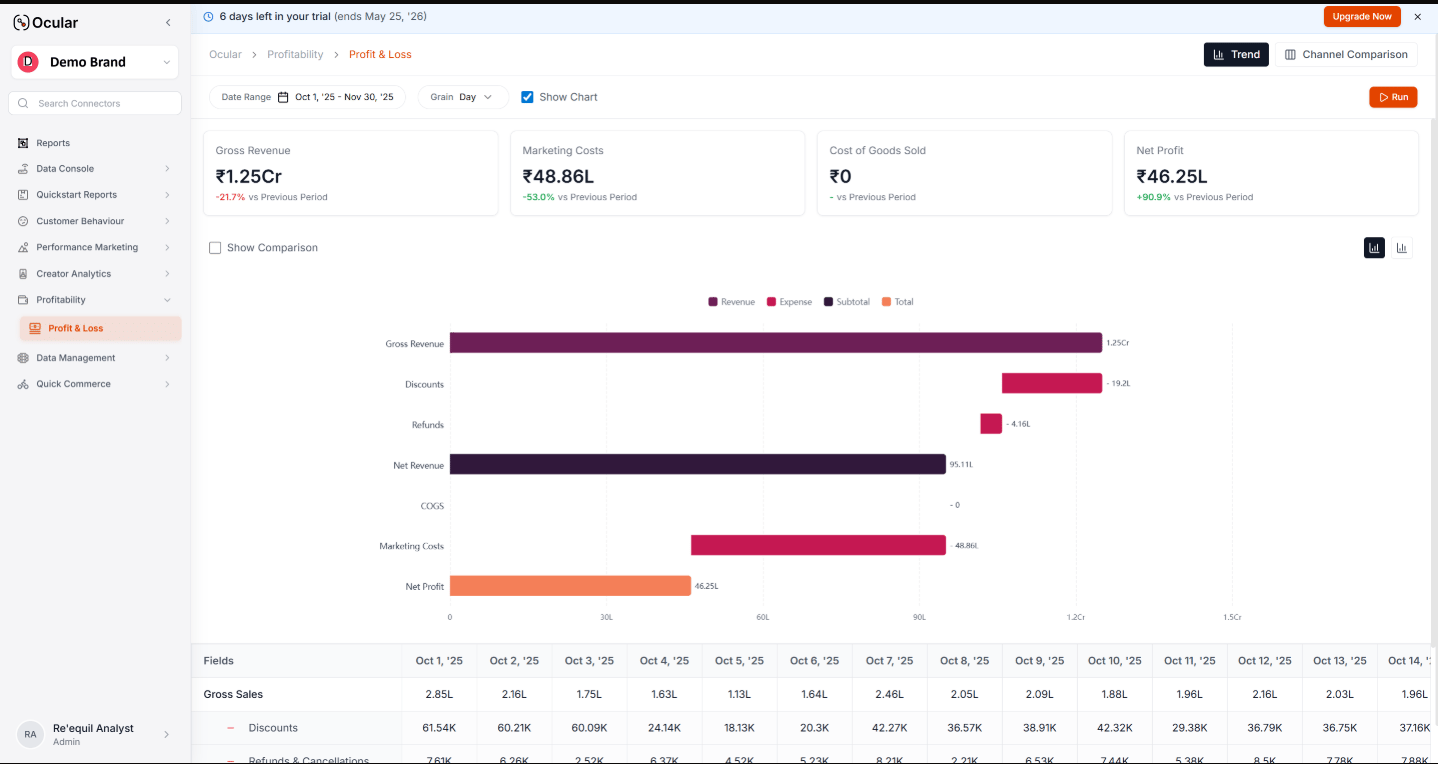
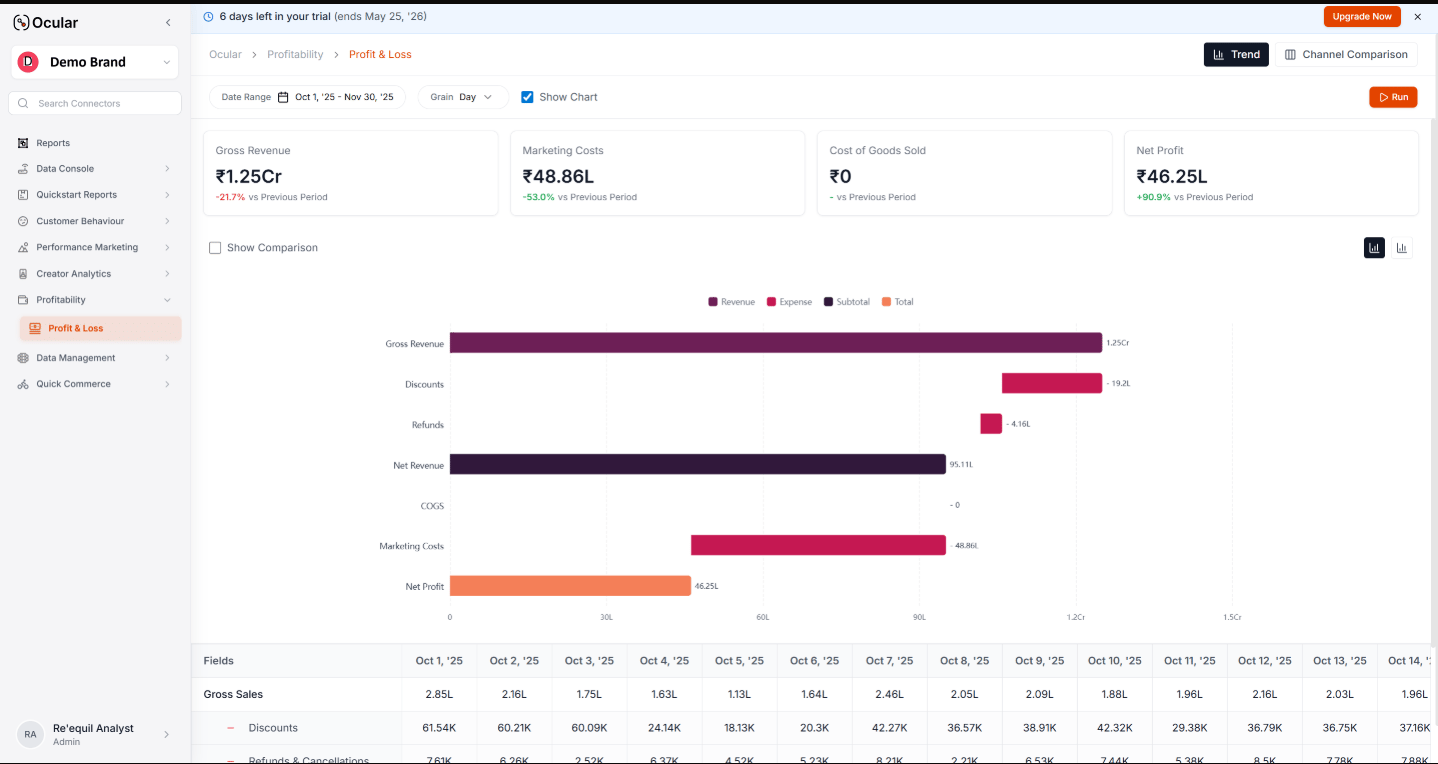
Ocular displays numbers in lakhs (1,00,000) and crores (1,00,00,000) across every chart, dashboard, KPI card, and export — alongside the standard million/billion format. Pick whichever matches how your team actually talks about revenue.
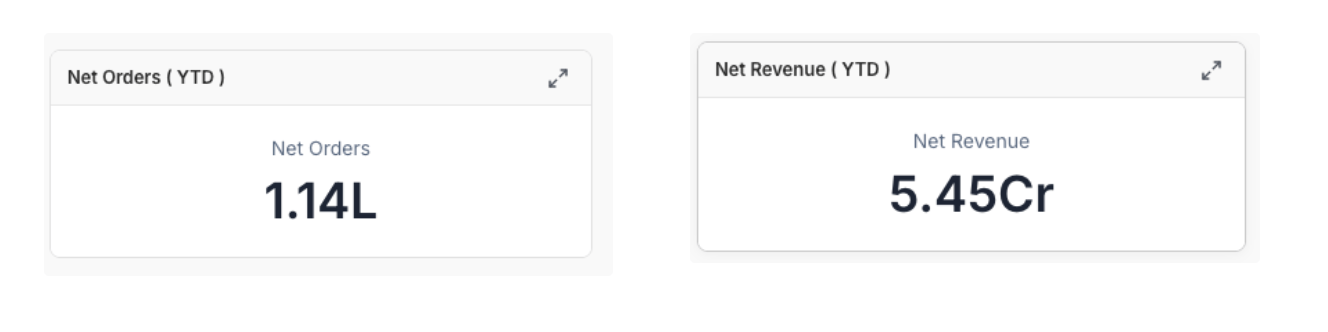
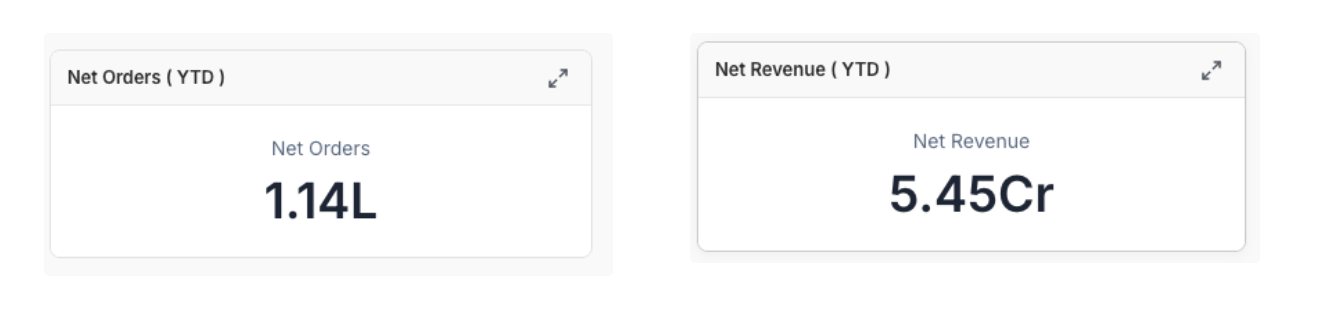 **Configured in:** Settings → Display Preferences → Number Format.
## Financial year calculations
Set your fiscal year start month once. Every date-based calculation — YTD, QoQ, YoY, fiscal-quarter rollups — automatically aligns to that calendar.
India, UK, Singapore
United States
Australia
**Configured in:** Settings → Display Preferences → Number Format.
## Financial year calculations
Set your fiscal year start month once. Every date-based calculation — YTD, QoQ, YoY, fiscal-quarter rollups — automatically aligns to that calendar.
India, UK, Singapore
United States
Australia
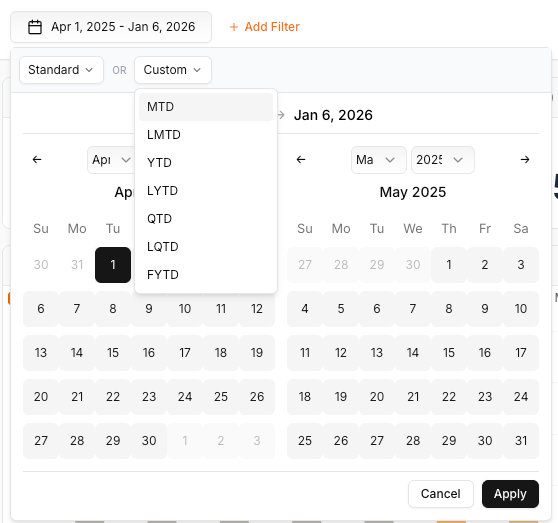
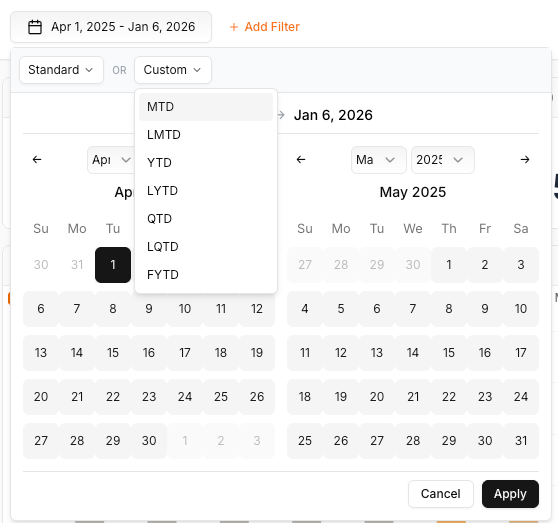 YTD, quarterly, and annual metrics roll up to your fiscal calendar.
Matches how your finance team actually reports numbers.
No need to rebuild date ranges for fiscal reporting.
Different fiscal calendars per entity, when needed.
**Configured in:** Settings → Display Preferences → Financial Year.
## UTC time-zone standardization
Commerce data arrives from systems that each record timestamps in their own time zone. Ocular converts every timestamp to UTC at ingestion, stores it in UTC, and displays it in your configured time zone.
The conversion is invisible — but it's what makes cross-platform comparisons trustworthy. Without it, you get:
Daily numbers fall on different calendar days depending on the source.
Attribution drifts between ad platform and storefront.
Hour-by-hour and day-over-day comparisons drift.
Channels can't be directly compared.
## Period comparison in pivot tables
Every pivot table has a comparison toggle that:
Previous week, month, quarter, or year — based on your current selection.
Absolute and percentage variance shown alongside each value.
Any custom range when the default doesn't fit.
Positive/negative cues match across every chart.
Available in every chart that supports period-over-period analysis — not just pre-built reports.
## Problem-driven quickstart
Most BI products give you a feature tour. Ocular's [Start with the question](/overview/start-with-the-question) is structured around real triggers — *"my margin looks wrong"*, *"a campaign is bleeding spend"*, *"returns are climbing"*, *"a courier keeps failing"* — and routes each one to the right module and decision.
## Modules generic BI doesn't have
Ad performance broken down by copy element — title, body, description, creative asset. Build briefs grounded in patterns, not gut feel.
Gross Revenue down to Contribution Margin, step by step. Switch to Channel Comparison for a side-by-side view.
Built-in CAC payback, LTV per cohort, and split-by acquisition channel, discount code, or geography — no SQL.
Event-based retention (add-to-cart, session start) as a leading indicator of purchase retention.
YTD, quarterly, and annual metrics roll up to your fiscal calendar.
Matches how your finance team actually reports numbers.
No need to rebuild date ranges for fiscal reporting.
Different fiscal calendars per entity, when needed.
**Configured in:** Settings → Display Preferences → Financial Year.
## UTC time-zone standardization
Commerce data arrives from systems that each record timestamps in their own time zone. Ocular converts every timestamp to UTC at ingestion, stores it in UTC, and displays it in your configured time zone.
The conversion is invisible — but it's what makes cross-platform comparisons trustworthy. Without it, you get:
Daily numbers fall on different calendar days depending on the source.
Attribution drifts between ad platform and storefront.
Hour-by-hour and day-over-day comparisons drift.
Channels can't be directly compared.
## Period comparison in pivot tables
Every pivot table has a comparison toggle that:
Previous week, month, quarter, or year — based on your current selection.
Absolute and percentage variance shown alongside each value.
Any custom range when the default doesn't fit.
Positive/negative cues match across every chart.
Available in every chart that supports period-over-period analysis — not just pre-built reports.
## Problem-driven quickstart
Most BI products give you a feature tour. Ocular's [Start with the question](/overview/start-with-the-question) is structured around real triggers — *"my margin looks wrong"*, *"a campaign is bleeding spend"*, *"returns are climbing"*, *"a courier keeps failing"* — and routes each one to the right module and decision.
## Modules generic BI doesn't have
Ad performance broken down by copy element — title, body, description, creative asset. Build briefs grounded in patterns, not gut feel.
Gross Revenue down to Contribution Margin, step by step. Switch to Channel Comparison for a side-by-side view.
Built-in CAC payback, LTV per cohort, and split-by acquisition channel, discount code, or geography — no SQL.
Event-based retention (add-to-cart, session start) as a leading indicator of purchase retention.
 ## Indian commerce stack as a first-class citizen
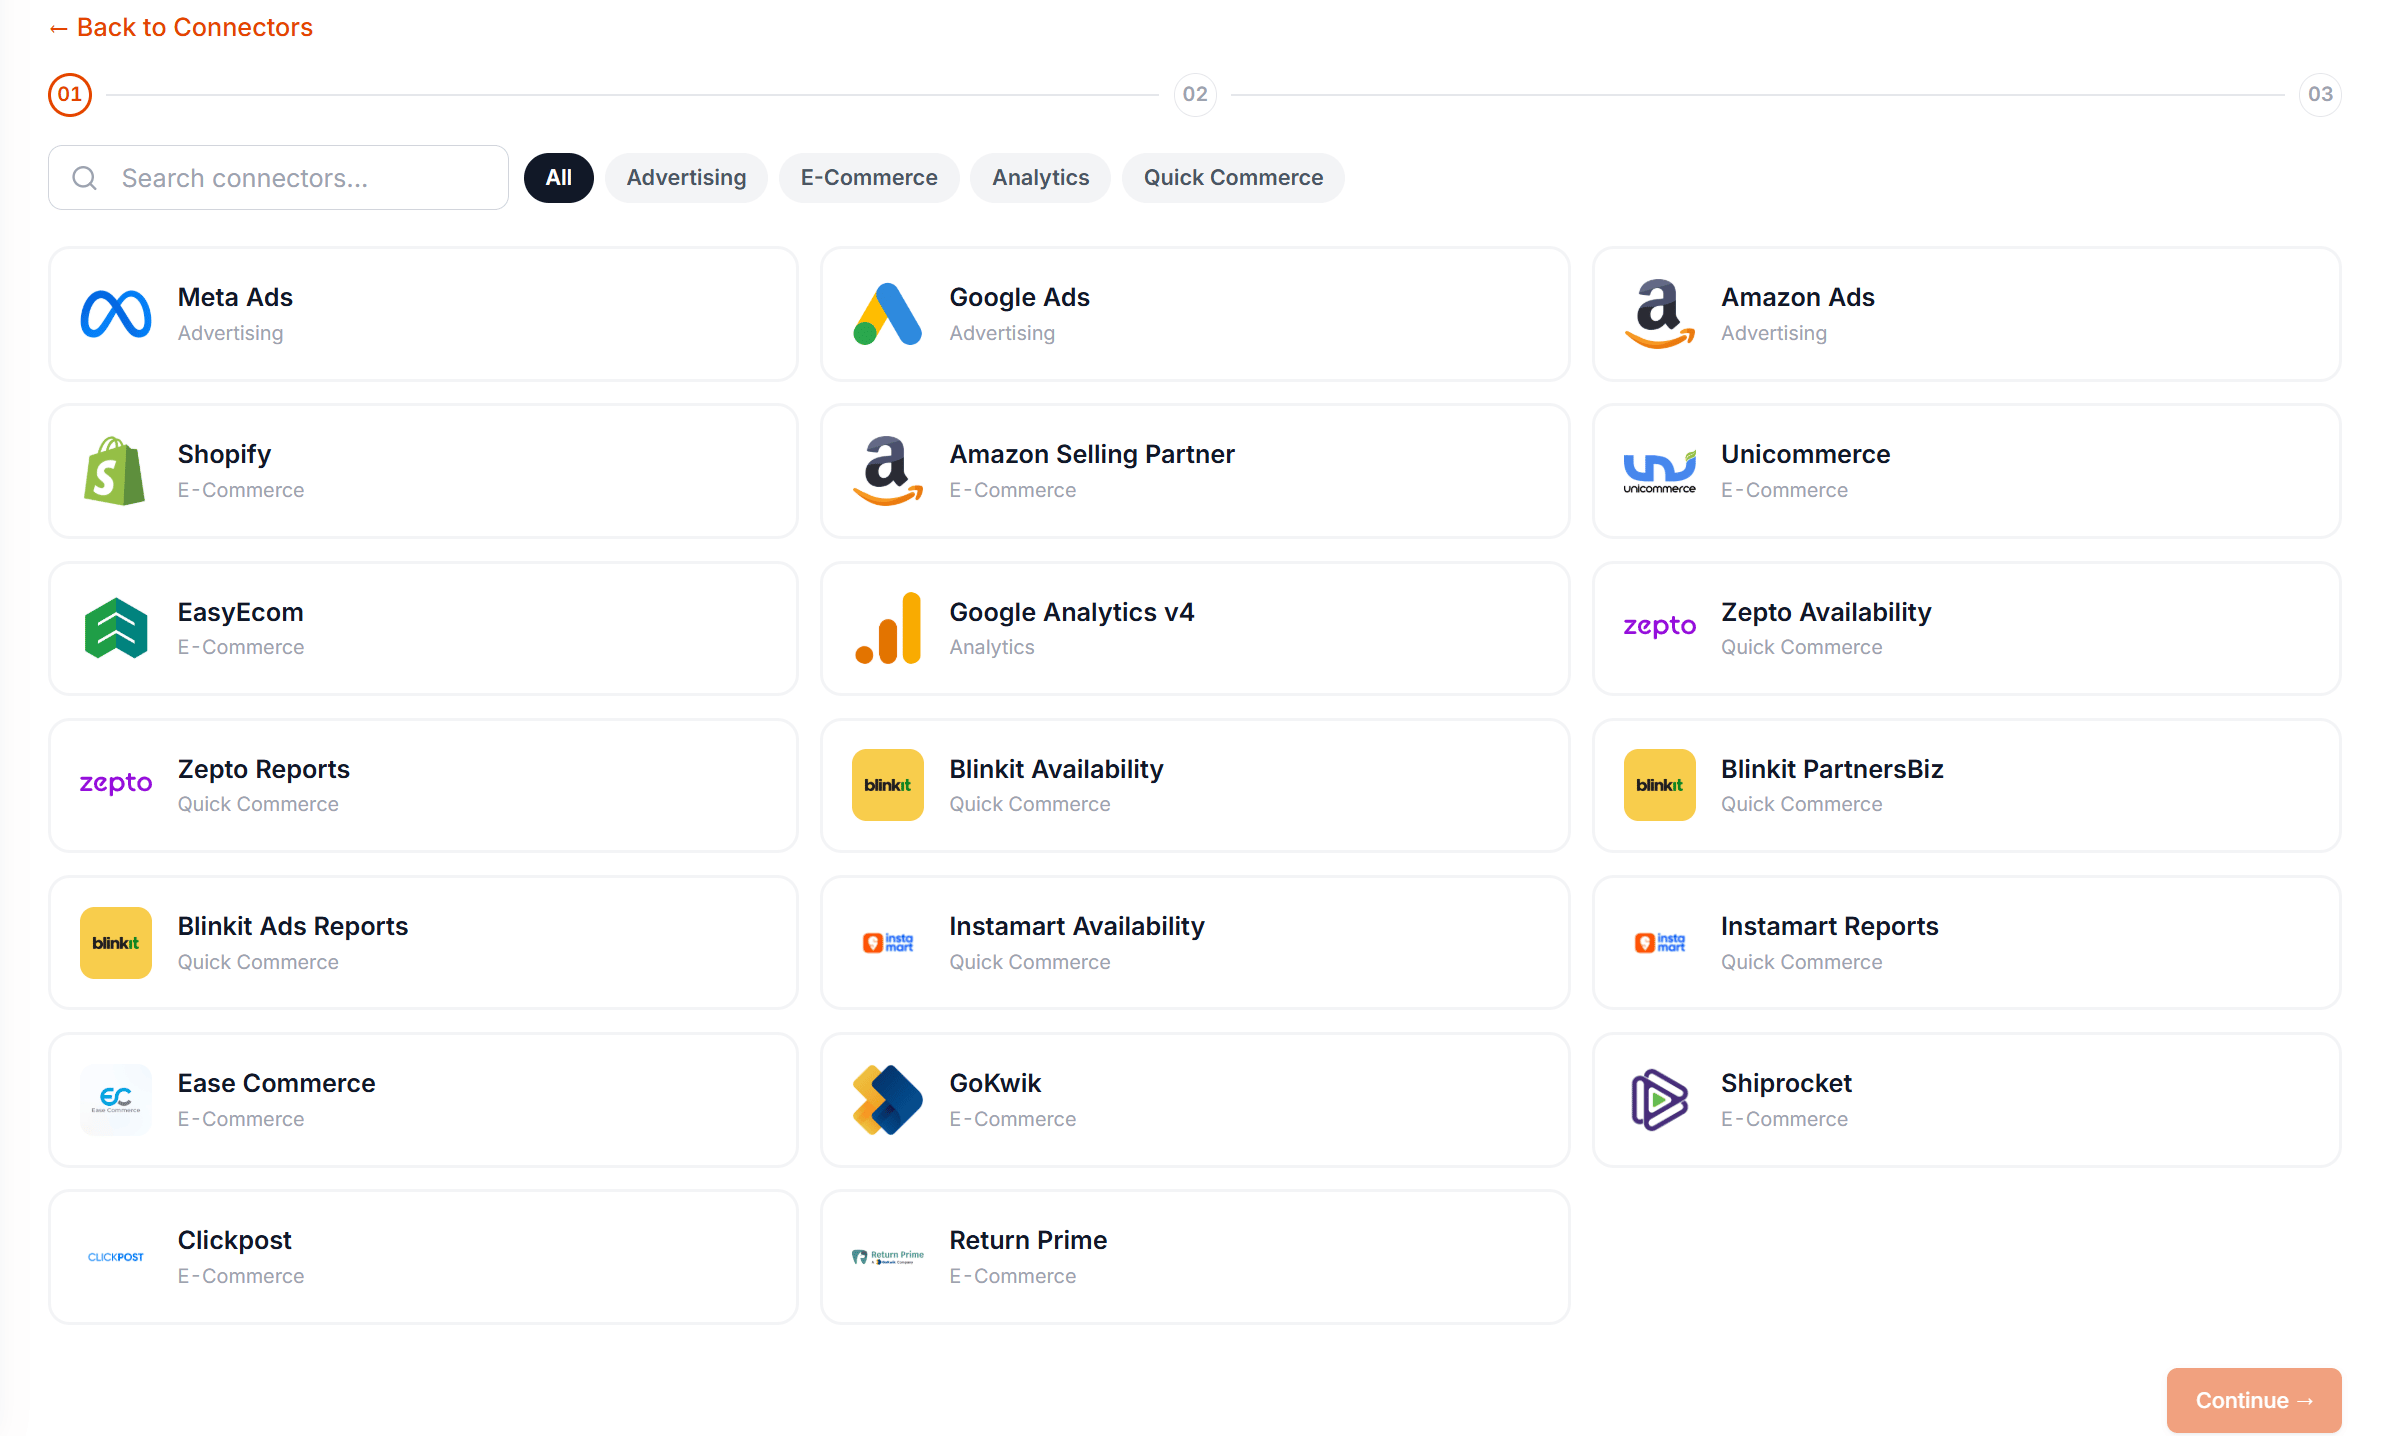
The integration catalogue is built around the platforms Indian D2C brands actually run on.
**Shopify**
**Blinkit**, **Zepto**, **Instamart** (plus seller-reporting and ads-reporting variants)
**Meta Ads**, **Google Ads**
**Google Analytics 4**
**Unicommerce**, **EasyEcom**, **Ease Commerce**
**GoKwik**
**Shiprocket**, **Clickpost**
**Return Prime**
Amazon Seller Central, Flipkart, Nykaa, Myntra, FirstCry
Klaviyo, MoEngage, WebEngage, HubSpot
Recurring-revenue platforms
Payment-gateway connectors
## Indian commerce stack as a first-class citizen
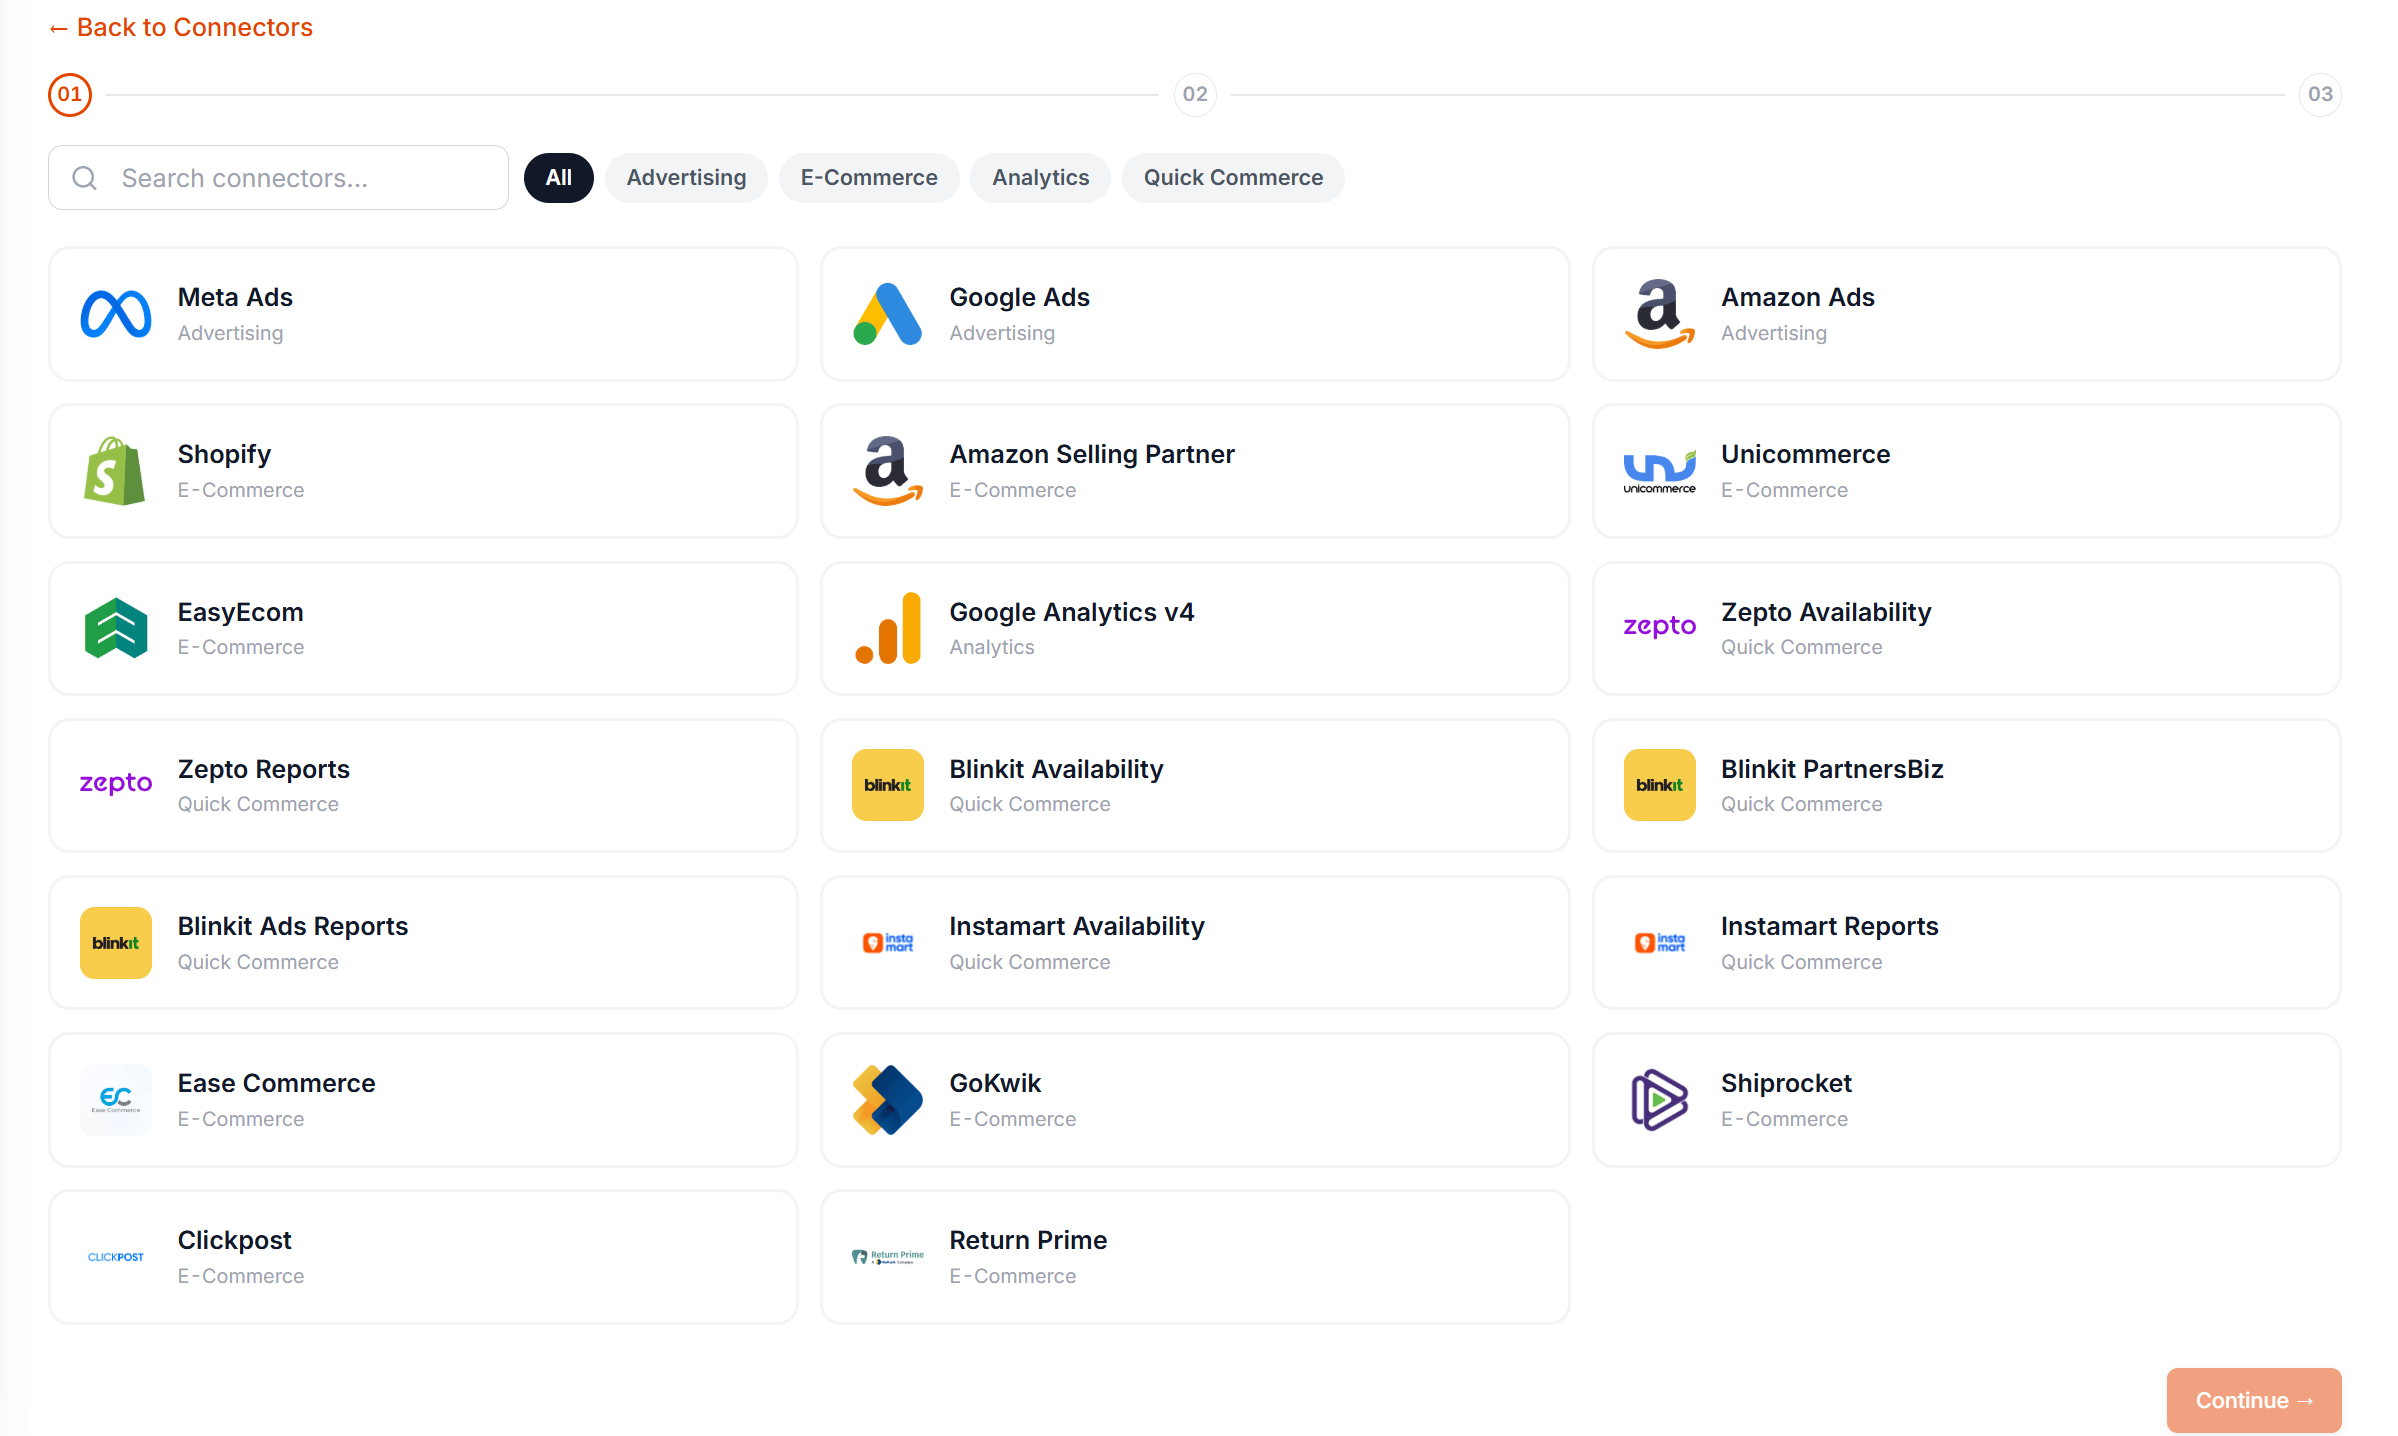
The integration catalogue is built around the platforms Indian D2C brands actually run on.
**Shopify**
**Blinkit**, **Zepto**, **Instamart** (plus seller-reporting and ads-reporting variants)
**Meta Ads**, **Google Ads**
**Google Analytics 4**
**Unicommerce**, **EasyEcom**, **Ease Commerce**
**GoKwik**
**Shiprocket**, **Clickpost**
**Return Prime**
Amazon Seller Central, Flipkart, Nykaa, Myntra, FirstCry
Klaviyo, MoEngage, WebEngage, HubSpot
Recurring-revenue platforms
Payment-gateway connectors
 Per-platform setup guides live in [Connect Your Data](/connectors/shopify). Check with the team for the latest roadmap status before planning around a connector that isn't live yet.
## Where to go next
Pick a reading order based on your role.
Jump to a specific business problem.
Implementation steps — 20 minutes.
Per-platform setup guides live in [Connect Your Data](/connectors/shopify). Check with the team for the latest roadmap status before planning around a connector that isn't live yet.
## Where to go next
Pick a reading order based on your role.
Jump to a specific business problem.
Implementation steps — 20 minutes.