> ## Documentation Index
> Fetch the complete documentation index at: https://docs.ocular.dev/llms.txt
> Use this file to discover all available pages before exploring further.
# User Activity Cohort
> Group users by a Start Event and track whether they return — retention curves, churn intervals, and engagement by acquisition channel, device, or geography.
User Activity Cohort lets you analyse how users engage with your website or app over time by grouping them on a key action and tracking whether they come back. It's one of the clearest signals of digital experience and brand health — helping teams understand retention, churn, and long-term engagement across channels and segments.
Think of it as your answer to a simple but critical question — *are users coming back, or are they quietly disappearing?*
## What is a User Activity Cohort
A User Activity Cohort groups users who perform a specific **Start Event** within the same time period, then tracks whether those same users return to perform a **Return Event** in subsequent periods.
It reveals:
* Retention rates over time
* Churn patterns at specific intervals
* Engagement trends by acquisition channel
* Event adoption and continued usage patterns
## Why this matters
Answers the trajectory questions:
* Are we building an engaging experience, or a leaky bucket?
* Which acquisition channels bring users who actually stay?
* Is our retention improving month over month?
Answers the diagnostic questions:
* What % of users who signed up last week are still active?
* Which features do power users return to repeatedly?
* Which user segments retain best, and why?
## How to use it - a worked example
### Scenario - a D2C skincare brand
A direct-to-consumer skincare brand acquires users through Instagram ads, influencer partnerships, and Google Shopping. The marketing team wants to know **which channels drive loyal, repeat buyers** — not just first-time purchasers.
### Defining the retention logic
Every User Activity Cohort is anchored on two events:
* **Start Event** — determines who enters the cohort
* **Return Event** — determines whether those users are retained
**Common mistake:** choosing a *conversion event* (like `purchase`) as both Start and Return often hides churn. For early-stage retention, use intent or engagement events instead.
#### Configuration
 | Setting | Value |
| ------------------------ | ------------------------------------------------------- |
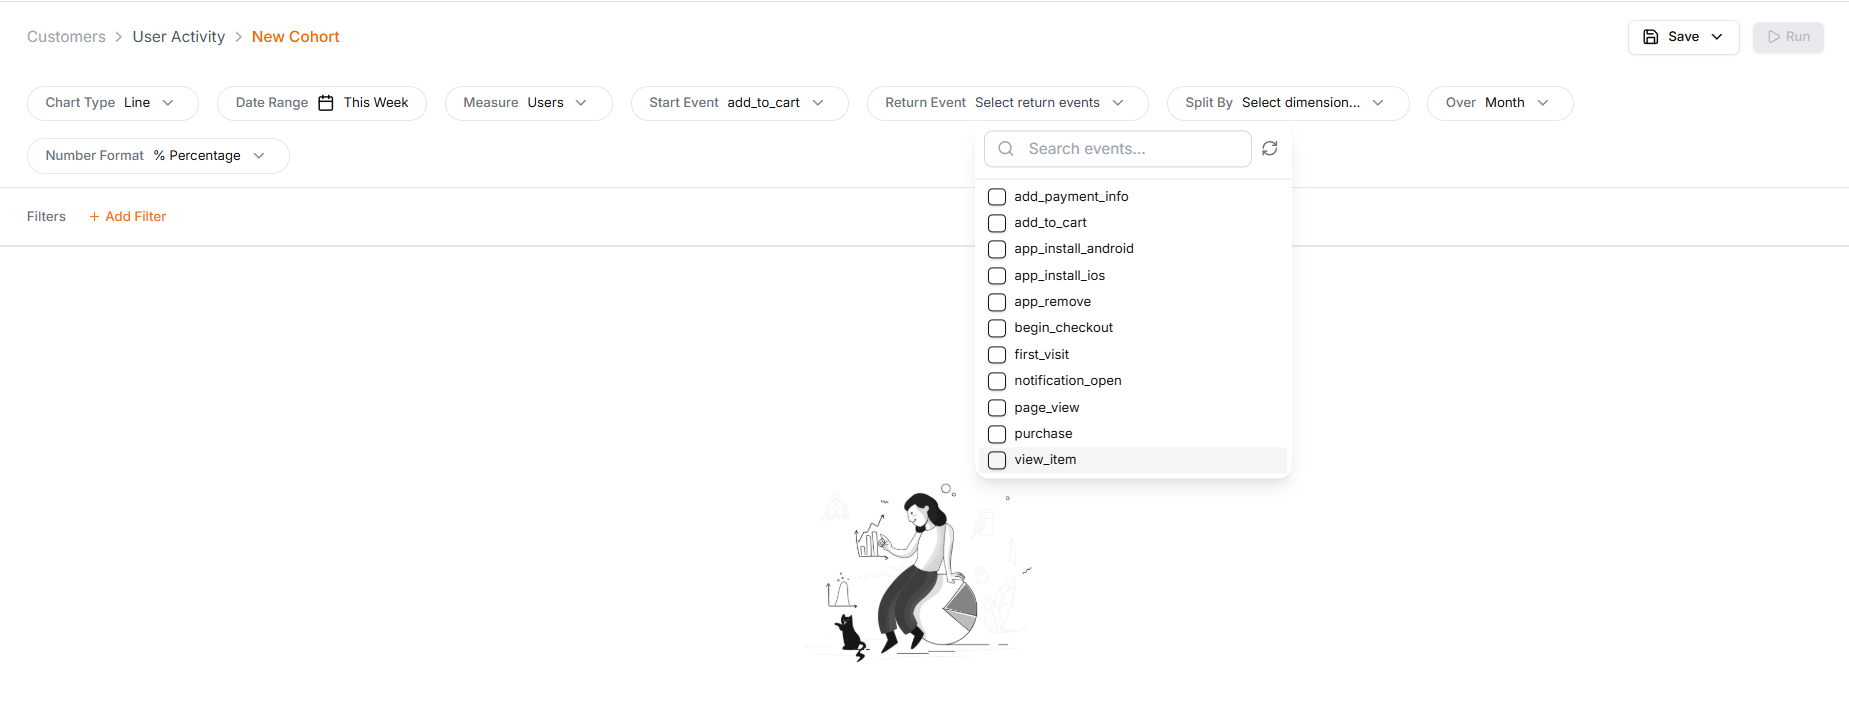
| **Start Event** | `add_to_cart` — signals initial product interest |
| **Return Event** | `session_start` — indicates the user returned to browse |
| **Split By** | Entry UTM Source *(Breakout mode)* |
| **Measure** | Users (unique) |
| **Time Granularity** | Week |
| **Date Range** | Last 90 days |
| **Value Representation** | Percentage |
### What the cohort reveals
**Sample retention output:**
| Acquisition Source | Week 0 | Week 1 | Week 2 | Week 4 | Week 8 | Week 12 |
| ------------------ | ------ | ------ | ------ | ------ | ------ | ------- |
| Instagram Ads | 100% | 28% | 15% | 8% | 5% | 4% |
| Influencer Posts | 100% | 42% | 31% | 22% | 18% | 16% |
| Google Shopping | 100% | 38% | 27% | 19% | 15% | 13% |
| Meta Ads | 100% | 25% | 12% | 6% | 4% | 3% |
| YouTube Ads | 100% | 35% | 24% | 16% | 12% | 10% |
### Actionable insights by team
Cohorts only become valuable when they drive different actions for different teams. The same retention curve should inform messaging, spend allocation, and roadmap decisions.
**Insights**
* Sharp drop-off between Week 1 (\~34%) and Week 2 (\~22%) across channels
* Users who don't return by Week 2 rarely become repeat visitors
**Actions**
* Trigger an automated WhatsApp/email journey at Day 10:
* Product usage education
* Reviews and before/after results
* Limited-time repeat-purchase offer
**Insights**
* Influencer cohorts show the flattest retention curve after Week 4 (16–18%)
* Indicates strong brand affinity
**Actions**
* Use this cohort for:
* Beta testing new launches
* UGC campaigns
* Referral programme recruitment
**Insights**
* Instagram and Meta ads have lower CPA (₹450) but poor long-term retention (4–5% at Week 8)
* Influencers cost more upfront but retain 3–4× better
**Actions**
* Track repurchase and CLV separately to assess true channel quality
## How the User Activity Cohort works
### Feature layout
The User Activity Cohort screen has two parts:
* **Retention Curve** - visual trend at the top
* **Cohort Table** - detailed breakdown below
| Setting | Value |
| ------------------------ | ------------------------------------------------------- |
| **Start Event** | `add_to_cart` — signals initial product interest |
| **Return Event** | `session_start` — indicates the user returned to browse |
| **Split By** | Entry UTM Source *(Breakout mode)* |
| **Measure** | Users (unique) |
| **Time Granularity** | Week |
| **Date Range** | Last 90 days |
| **Value Representation** | Percentage |
### What the cohort reveals
**Sample retention output:**
| Acquisition Source | Week 0 | Week 1 | Week 2 | Week 4 | Week 8 | Week 12 |
| ------------------ | ------ | ------ | ------ | ------ | ------ | ------- |
| Instagram Ads | 100% | 28% | 15% | 8% | 5% | 4% |
| Influencer Posts | 100% | 42% | 31% | 22% | 18% | 16% |
| Google Shopping | 100% | 38% | 27% | 19% | 15% | 13% |
| Meta Ads | 100% | 25% | 12% | 6% | 4% | 3% |
| YouTube Ads | 100% | 35% | 24% | 16% | 12% | 10% |
### Actionable insights by team
Cohorts only become valuable when they drive different actions for different teams. The same retention curve should inform messaging, spend allocation, and roadmap decisions.
**Insights**
* Sharp drop-off between Week 1 (\~34%) and Week 2 (\~22%) across channels
* Users who don't return by Week 2 rarely become repeat visitors
**Actions**
* Trigger an automated WhatsApp/email journey at Day 10:
* Product usage education
* Reviews and before/after results
* Limited-time repeat-purchase offer
**Insights**
* Influencer cohorts show the flattest retention curve after Week 4 (16–18%)
* Indicates strong brand affinity
**Actions**
* Use this cohort for:
* Beta testing new launches
* UGC campaigns
* Referral programme recruitment
**Insights**
* Instagram and Meta ads have lower CPA (₹450) but poor long-term retention (4–5% at Week 8)
* Influencers cost more upfront but retain 3–4× better
**Actions**
* Track repurchase and CLV separately to assess true channel quality
## How the User Activity Cohort works
### Feature layout
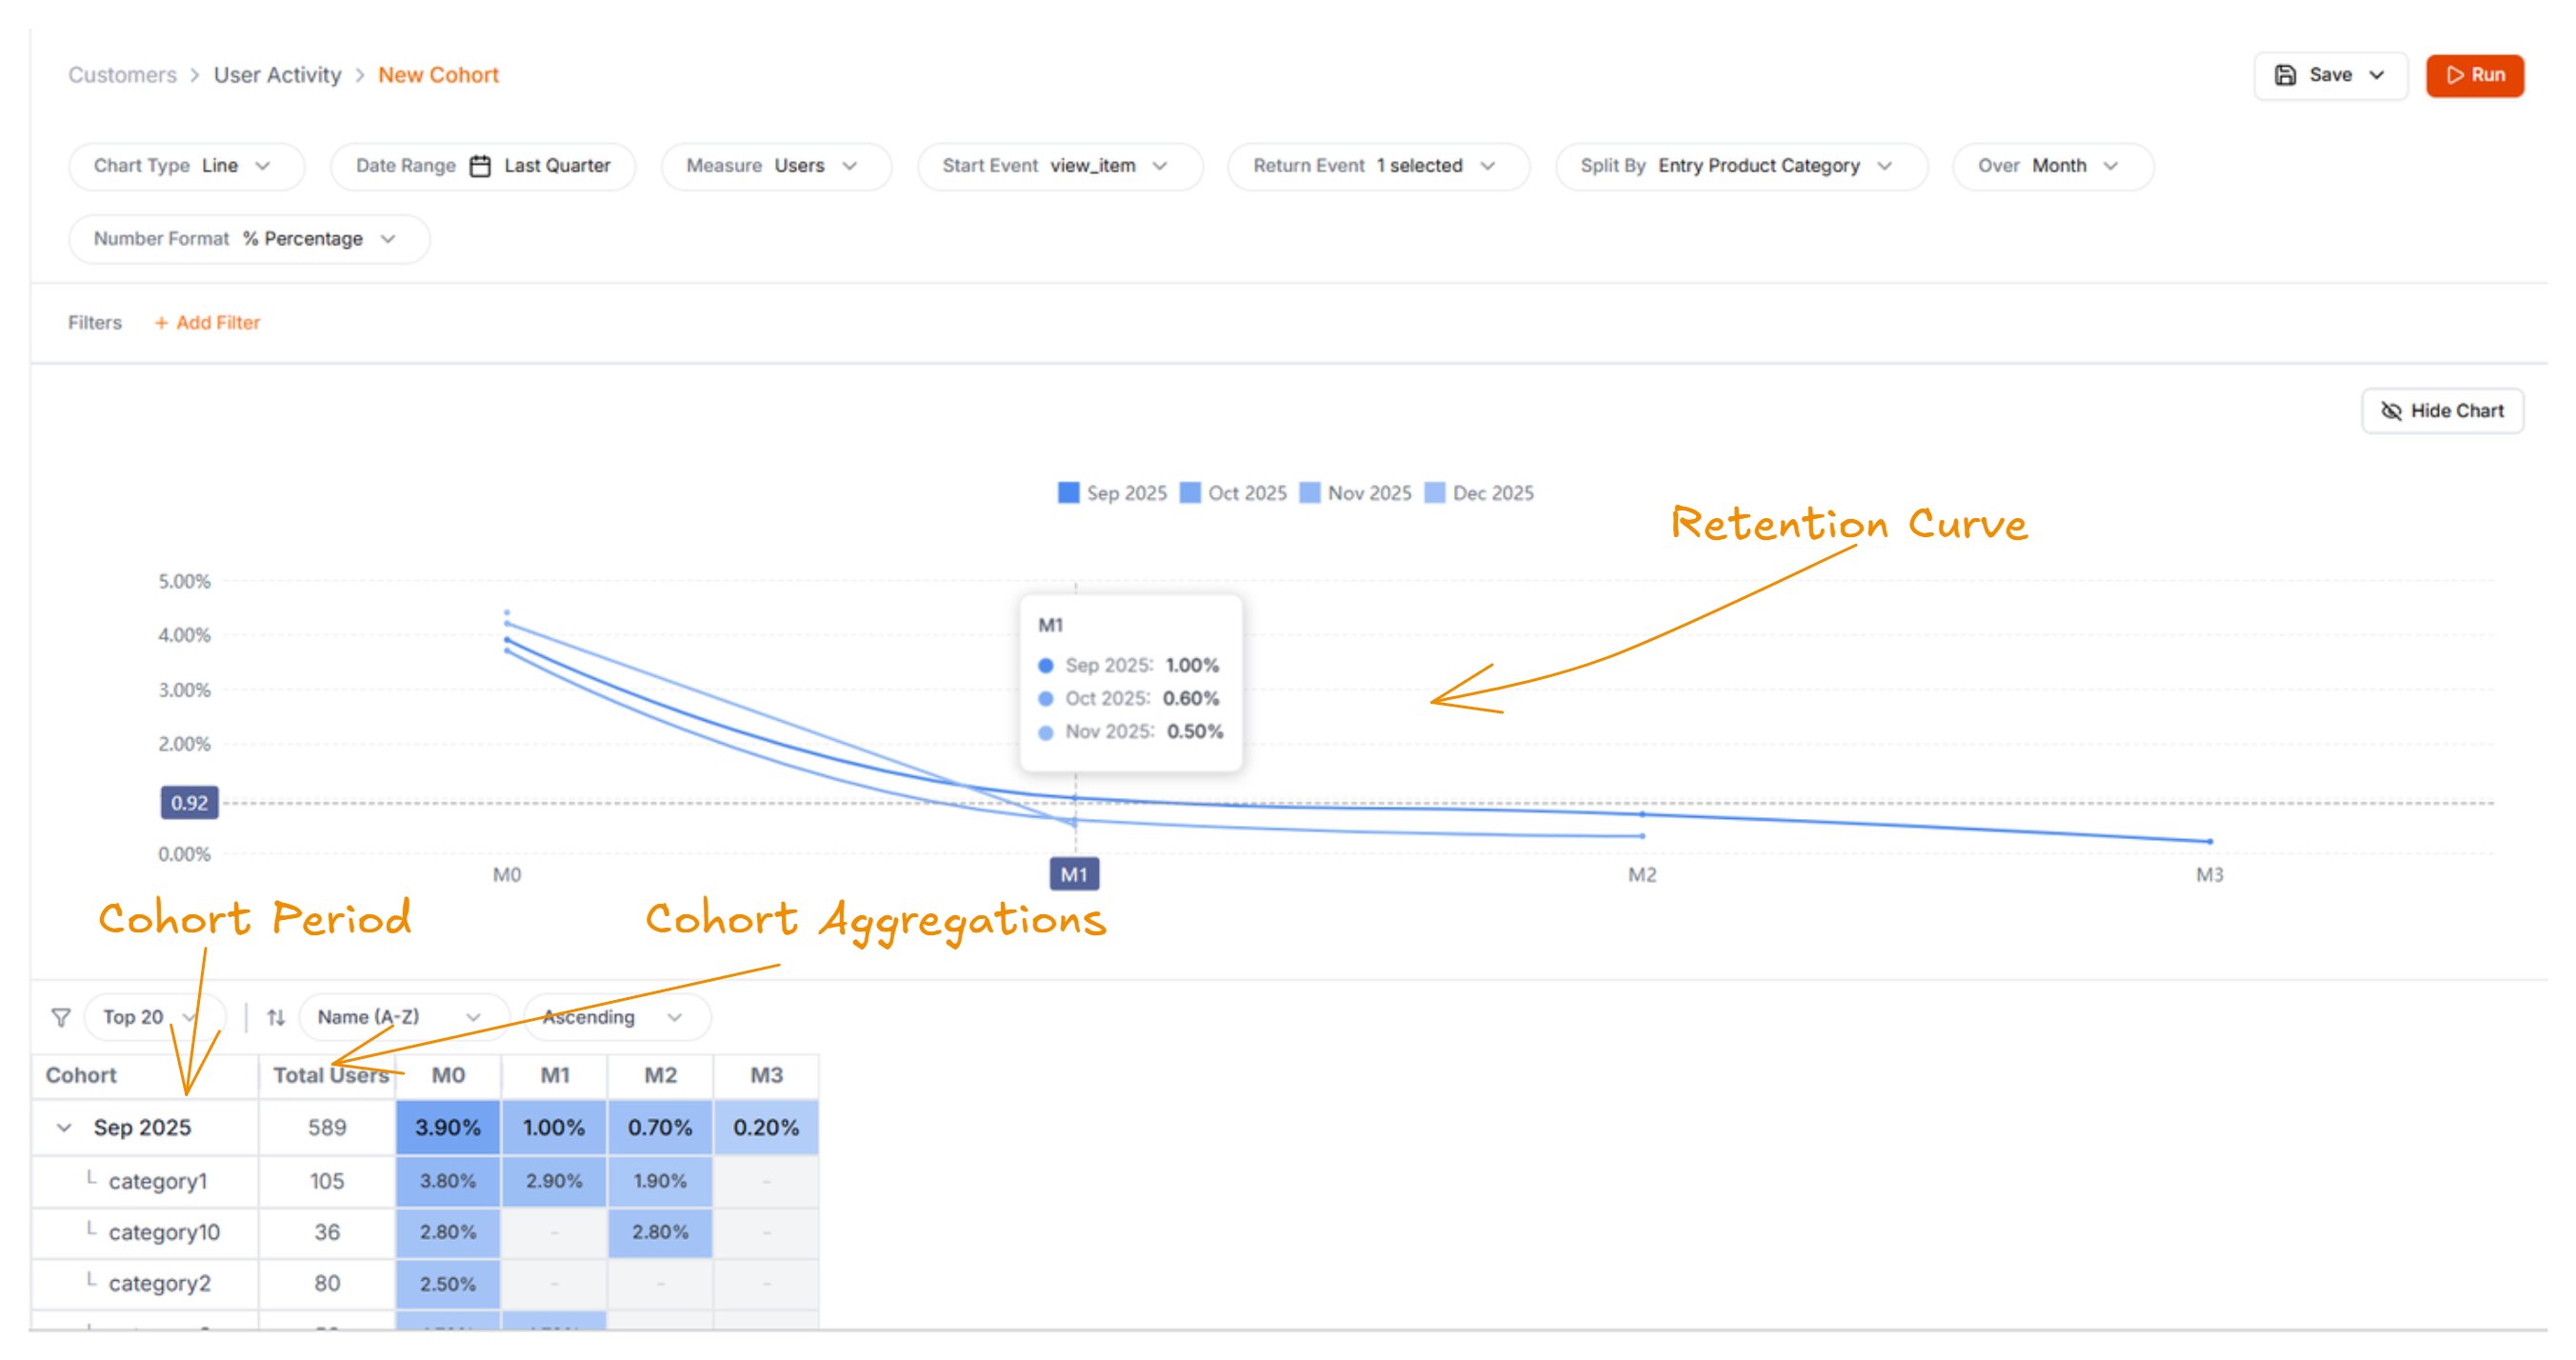
The User Activity Cohort screen has two parts:
* **Retention Curve** - visual trend at the top
* **Cohort Table** - detailed breakdown below
 ### Visualisation options
* **Chart type:** Line, Area, Bar
* **Number format:** Absolute values or Percentages
### Cohort table — what each column means
| Column | What it shows |
| ---------------------- | ------------------------------------------------- |
| **A** | Cohort period (e.g. *Week of Nov 20–26*) |
| **B** | Cohort aggregations (unique users, total revenue) |
| **Subsequent columns** | Retention in later periods |
Percentages are rounded to 2 decimal places.
### Defining your analysis — the query bar
The top of the screen lets you define the behaviour and parameters for your analysis.
Every selection here changes *who* is considered retained.
#### 1. Measure & events
**Measure** determines what fills each cohort cell.
### Visualisation options
* **Chart type:** Line, Area, Bar
* **Number format:** Absolute values or Percentages
### Cohort table — what each column means
| Column | What it shows |
| ---------------------- | ------------------------------------------------- |
| **A** | Cohort period (e.g. *Week of Nov 20–26*) |
| **B** | Cohort aggregations (unique users, total revenue) |
| **Subsequent columns** | Retention in later periods |
Percentages are rounded to 2 decimal places.
### Defining your analysis — the query bar
The top of the screen lets you define the behaviour and parameters for your analysis.
Every selection here changes *who* is considered retained.
#### 1. Measure & events
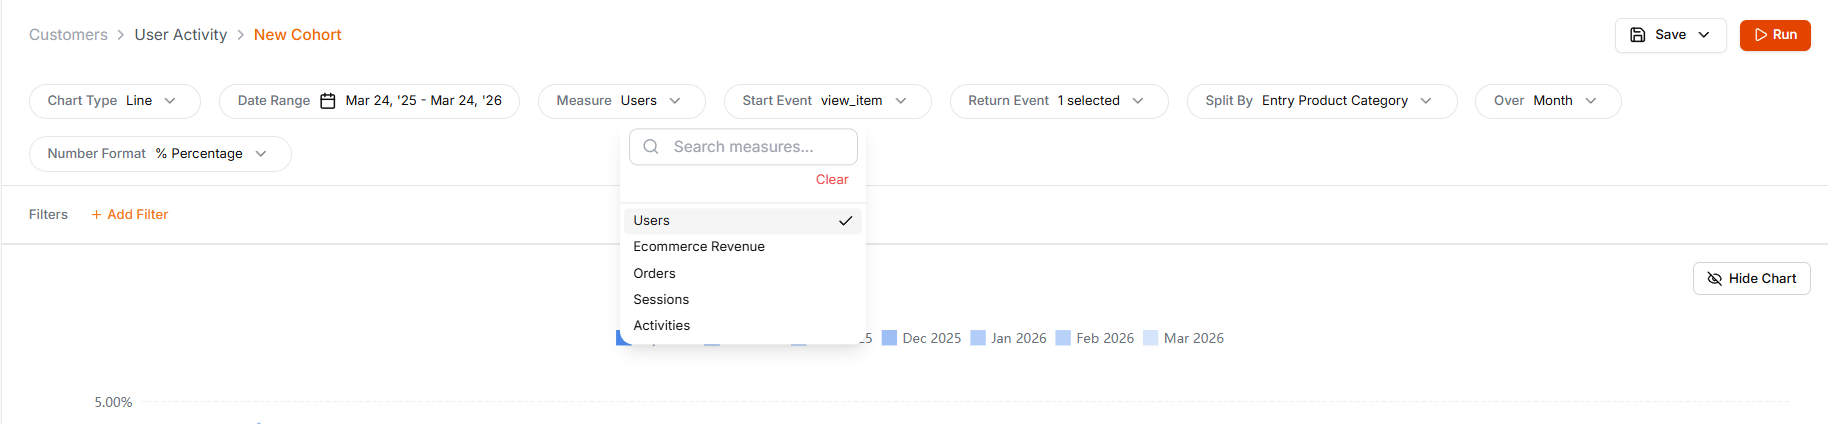
**Measure** determines what fills each cohort cell.
 | Measure | Description |
| --------------------- | ------------------------------------------------------------------------------------------------------ |
| **Users** | Distinct users (by `pseudo_user_id`) who performed the selected events during the selected time period |
| **Ecommerce Revenue** | Total purchase revenue from ecommerce events attributed to users in the cohort |
| **Orders** | Total purchase events recorded for users in the cohort |
| **Sessions** | Sessions initiated by users in the cohort |
| **Activities** | Total count of GA4 events performed by users in the cohort |
**Start Event** and **Return Event** define the lifecycle you're tracking. Both are pulled from your GA4 event schema.
#### 2. Time and granularity
Granularity should match natural user behaviour. **Weekly** cohorts work well for commerce, while **daily** cohorts are better for habit-based experiences.
* **Date Range:** 7d, 30d, This Month, FYTD, Custom, etc.
* **Granularity:** Day, Week, Month, Quarter, Year
Choose granularity based on expected user return frequency.
#### 3. Start Event
Defines who enters the cohort.
| Start Event | Use case |
| ---------------- | ------------------------ |
| `session_start` | General visits |
| `user_signed_up` | New users |
| `added_to_cart` | Purchase intent |
| `product_viewed` | Content or item interest |
| `app_opened` | App usage |
#### 4. Return Event
Defines what counts as retention.
| Start Event | Return Event | Insight |
| ---------------- | --------------- | ------------------- |
| `added_to_cart` | `session_start` | Browse retention |
| `session_start` | `session_start` | Visit frequency |
| `product_viewed` | `added_to_cart` | Intent → action |
| `user_signed_up` | `session_start` | New user engagement |
| `app_opened` | `app_opened` | App retention |
#### 5. Split By (segmentation)
| Measure | Description |
| --------------------- | ------------------------------------------------------------------------------------------------------ |
| **Users** | Distinct users (by `pseudo_user_id`) who performed the selected events during the selected time period |
| **Ecommerce Revenue** | Total purchase revenue from ecommerce events attributed to users in the cohort |
| **Orders** | Total purchase events recorded for users in the cohort |
| **Sessions** | Sessions initiated by users in the cohort |
| **Activities** | Total count of GA4 events performed by users in the cohort |
**Start Event** and **Return Event** define the lifecycle you're tracking. Both are pulled from your GA4 event schema.
#### 2. Time and granularity
Granularity should match natural user behaviour. **Weekly** cohorts work well for commerce, while **daily** cohorts are better for habit-based experiences.
* **Date Range:** 7d, 30d, This Month, FYTD, Custom, etc.
* **Granularity:** Day, Week, Month, Quarter, Year
Choose granularity based on expected user return frequency.
#### 3. Start Event
Defines who enters the cohort.
| Start Event | Use case |
| ---------------- | ------------------------ |
| `session_start` | General visits |
| `user_signed_up` | New users |
| `added_to_cart` | Purchase intent |
| `product_viewed` | Content or item interest |
| `app_opened` | App usage |
#### 4. Return Event
Defines what counts as retention.
| Start Event | Return Event | Insight |
| ---------------- | --------------- | ------------------- |
| `added_to_cart` | `session_start` | Browse retention |
| `session_start` | `session_start` | Visit frequency |
| `product_viewed` | `added_to_cart` | Intent → action |
| `user_signed_up` | `session_start` | New user engagement |
| `app_opened` | `app_opened` | App retention |
#### 5. Split By (segmentation)
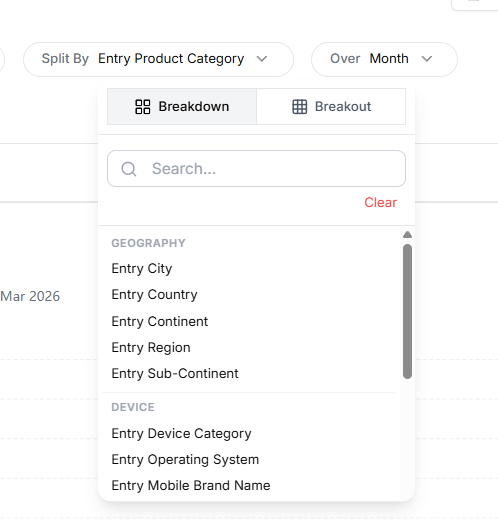 Split cohorts by **entry-level attributes** to compare retention across segments:
* Entry UTM Source / Medium / Campaign
* Entry City, Country
* Entry Device
* Entry Page
**Two split modes** — same data, different pivot:
**Cohort period stays the primary row.** Each cohort week is broken down into nested sub-rows, one per split-by value.
*Example:* Split by Entry City → expand **Week Jan 1–7** to see Mumbai, Delhi, Bangalore as nested rows inside it, each with its own Week 0/1/2/4… retention.
Use when you want to see the segment composition *within* each acquisition period.
**Split-by value becomes the primary row.** Each segment is broken out into its own complete cohort row across cohort weeks.
*Example:* Split by Entry City → one row for the Mumbai cohort, one for Delhi, one for Bangalore, each with its own Week 0/1/2/4 retention timeline.
Use when you want to compare retention curves side-by-side across segments.
**Top-N filtering:** limit to Top 10 / 20 / 50 values; the rest are grouped as *Others*.
#### 6. Advanced filtering & logic
Split cohorts by **entry-level attributes** to compare retention across segments:
* Entry UTM Source / Medium / Campaign
* Entry City, Country
* Entry Device
* Entry Page
**Two split modes** — same data, different pivot:
**Cohort period stays the primary row.** Each cohort week is broken down into nested sub-rows, one per split-by value.
*Example:* Split by Entry City → expand **Week Jan 1–7** to see Mumbai, Delhi, Bangalore as nested rows inside it, each with its own Week 0/1/2/4… retention.
Use when you want to see the segment composition *within* each acquisition period.
**Split-by value becomes the primary row.** Each segment is broken out into its own complete cohort row across cohort weeks.
*Example:* Split by Entry City → one row for the Mumbai cohort, one for Delhi, one for Bangalore, each with its own Week 0/1/2/4 retention timeline.
Use when you want to compare retention curves side-by-side across segments.
**Top-N filtering:** limit to Top 10 / 20 / 50 values; the rest are grouped as *Others*.
#### 6. Advanced filtering & logic
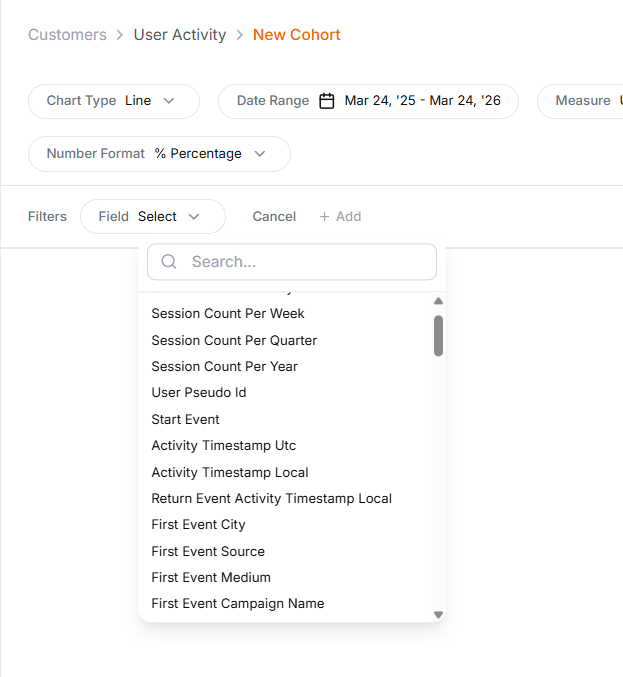 **Entry filters** — applied at the time of the **Start Event**.
**Common mistake:** assuming Entry Filters apply retroactively. They only evaluate attributes *at the moment* the Start Event occurs.
Examples:
* Entry UTM Source = Instagram
* Entry City = Mumbai
* Entry Device = Mobile
**Return filters** — applied at the time of the **Return Event**.
Return Filters let you isolate *how* users came back, not just *if* they came back — critical for evaluating re-engagement efforts.
Examples:
* Return UTM Source = Email
* Return Device = Desktop
* Return Page = Product Detail Page
**Combining entry & return filters** to answer deeper questions:
| Question | Entry filter | Return filter |
| ------------------------------------------------------------------- | --------------------------- | ----------------------------- |
| Do mobile browsers convert better when they return on desktop? | Entry Device: Mobile | Return Device: Desktop |
| How many Instagram-acquired users returned via our email campaigns? | Entry UTM Source: Instagram | Return UTM Source: Email |
| Do users who travel retain engagement across locations? | Entry City: Mumbai | Return City: Delhi, Bangalore |
**Filter logic:**
| Combination | Logic |
| ------------------------------------------ | ------- |
| **Multiple values within the same filter** | **OR** |
| **Different filter types combined** | **AND** |
## Tips for analysing retention
### Key interpretation rules
* **A user belongs to only one cohort** — based on their first Start Event. A user in the *Jan 1–6* cohort won't also appear in *Jan 7–14*.
* **A user can appear in multiple retention periods** — they could be counted in Week 1, Week 5, or all weeks. This is the desired behaviour and indicates strong retention.
### Save a cohort for reuse
You can save a User Activity Cohort configuration to reuse without rebuilding it.
**What gets saved:**
* Start Event and Return Event definitions
* Measure selection
* Date range and granularity
* Split-by configuration and mode
* Entry and Return filters
Saved cohorts appear in your **Saved Analyses** list and can be reopened, edited, or duplicated via *Save as*.
## Wrap-up
User Activity Cohort turns raw GA4 event data into clear answers about growth, retention, and revenue impact.
By understanding *who comes back, when, and after which actions*, teams can identify high-value behaviours, spot drop-offs early, and prioritise what actually moves outcomes.
Saved, reusable cohorts keep those insights consistent across reporting, experimentation, and activation — so decisions are grounded in user behaviour, not assumptions.
**Entry filters** — applied at the time of the **Start Event**.
**Common mistake:** assuming Entry Filters apply retroactively. They only evaluate attributes *at the moment* the Start Event occurs.
Examples:
* Entry UTM Source = Instagram
* Entry City = Mumbai
* Entry Device = Mobile
**Return filters** — applied at the time of the **Return Event**.
Return Filters let you isolate *how* users came back, not just *if* they came back — critical for evaluating re-engagement efforts.
Examples:
* Return UTM Source = Email
* Return Device = Desktop
* Return Page = Product Detail Page
**Combining entry & return filters** to answer deeper questions:
| Question | Entry filter | Return filter |
| ------------------------------------------------------------------- | --------------------------- | ----------------------------- |
| Do mobile browsers convert better when they return on desktop? | Entry Device: Mobile | Return Device: Desktop |
| How many Instagram-acquired users returned via our email campaigns? | Entry UTM Source: Instagram | Return UTM Source: Email |
| Do users who travel retain engagement across locations? | Entry City: Mumbai | Return City: Delhi, Bangalore |
**Filter logic:**
| Combination | Logic |
| ------------------------------------------ | ------- |
| **Multiple values within the same filter** | **OR** |
| **Different filter types combined** | **AND** |
## Tips for analysing retention
### Key interpretation rules
* **A user belongs to only one cohort** — based on their first Start Event. A user in the *Jan 1–6* cohort won't also appear in *Jan 7–14*.
* **A user can appear in multiple retention periods** — they could be counted in Week 1, Week 5, or all weeks. This is the desired behaviour and indicates strong retention.
### Save a cohort for reuse
You can save a User Activity Cohort configuration to reuse without rebuilding it.
**What gets saved:**
* Start Event and Return Event definitions
* Measure selection
* Date range and granularity
* Split-by configuration and mode
* Entry and Return filters
Saved cohorts appear in your **Saved Analyses** list and can be reopened, edited, or duplicated via *Save as*.
## Wrap-up
User Activity Cohort turns raw GA4 event data into clear answers about growth, retention, and revenue impact.
By understanding *who comes back, when, and after which actions*, teams can identify high-value behaviours, spot drop-offs early, and prioritise what actually moves outcomes.
Saved, reusable cohorts keep those insights consistent across reporting, experimentation, and activation — so decisions are grounded in user behaviour, not assumptions.