> ## Documentation Index
> Fetch the complete documentation index at: https://docs.ocular.dev/llms.txt
> Use this file to discover all available pages before exploring further.
# Purchase Retention Cohort
> Track how customers come back and keep buying in Ocular — repeat purchase rate, LTV per cohort, and CAC payback by acquisition channel, code, or geo.
Purchase Retention Cohort answers one of the most critical questions for any commerce business:
*Are customers coming back to buy again, and how much are they spending over time?*
Not just repeat-purchase volume - the complete lifecycle of customer value: how acquisition channels translate into long-term revenue, where customers drop off, whether CAC actually pays back, and which segments deliver the highest LTV.
## What is a Purchase Retention Cohort
A Purchase Retention Cohort groups customers whose **first purchase** falls within the same time period, then tracks whether those same customers make **additional purchases** in subsequent periods.
It reveals:
* Repeat purchase rates over time
* Purchase churn and drop-off points
* Long-term revenue and margin contribution
* Retention performance by acquisition channel, product, or geography
## Why this matters
Answers the unit-economics questions:
* Are we building repeat demand, or relying on one-time buyers?
* Which channels deliver profitable customers, not just volume?
* How long does it take to recover CAC?
* Is customer lifetime value improving over time?
Answers the diagnostic questions:
* What percentage of first-time buyers ever purchase again?
* When do most customers churn after their first order?
* Which first-purchase products lead to higher LTV?
* How does retention differ by discount strategy or geography?
## How to use it: A worked example
### Scenario - A D2C skincare brand
You're evaluating a D2C skincare brand that recently acquired 5,000 new customers. You want to know which **discount codes** delivered customers who actually stuck around.
#### Configuration
{/* TODO: Replace with screenshot of the cohort configuration panel — image-20260130-104207.png from source doc */}
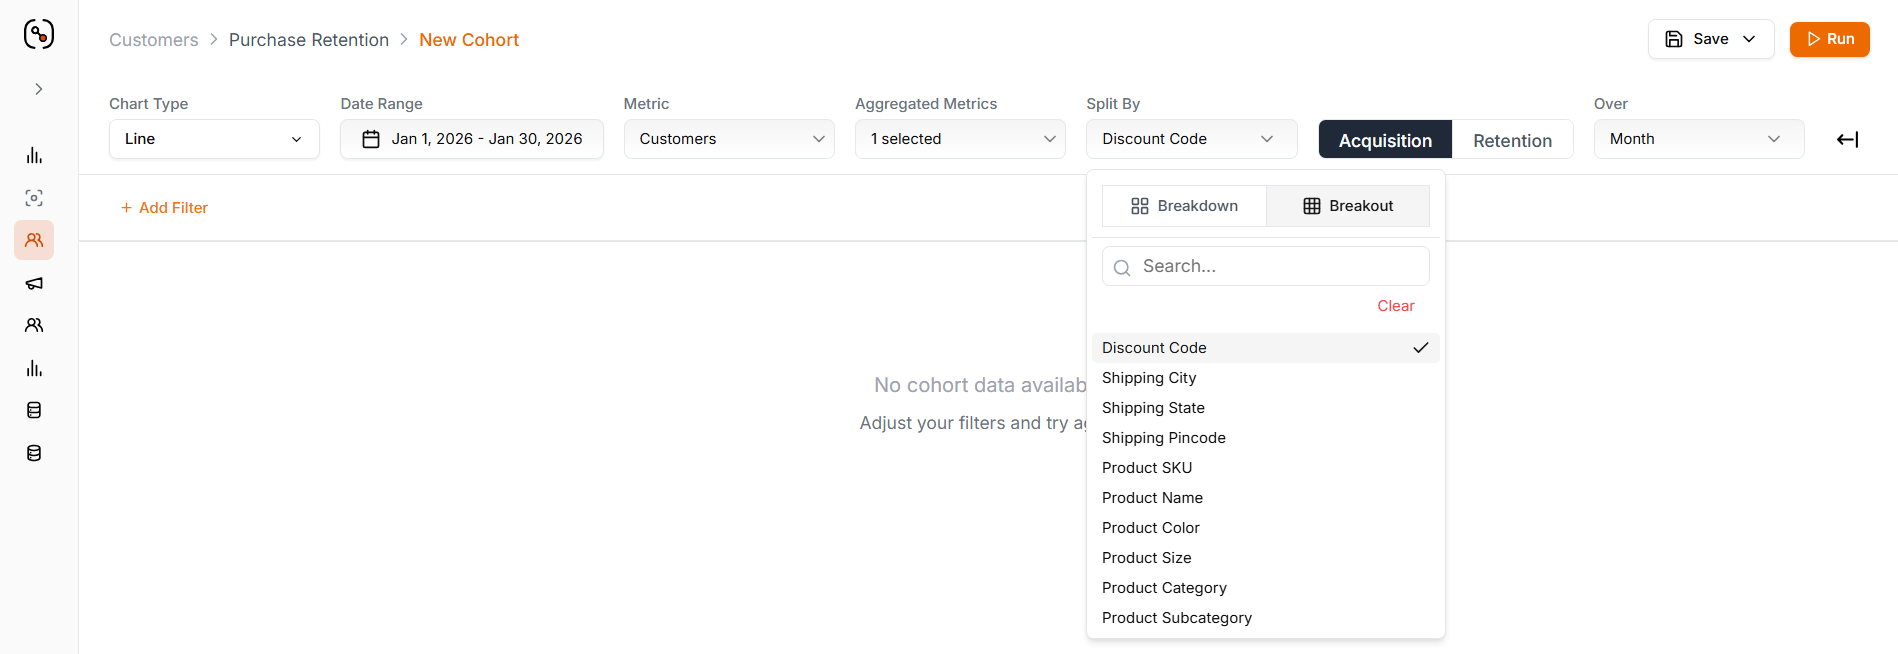 | Setting | Value |
| ------------------------ | --------------------------------------------- |
| **Split By** | Discount Code (Acquisition) — *Breakout mode* |
| **Measure** | Customers |
| **Time Granularity** | Month |
| **Date Range** | Last 6 months |
| **Value Representation** | Percentage |
#### What the Cohort Reveals
{/* TODO: Replace with screenshot of the resulting cohort table — image-20260130-104250.png from source doc */}
| Setting | Value |
| ------------------------ | --------------------------------------------- |
| **Split By** | Discount Code (Acquisition) — *Breakout mode* |
| **Measure** | Customers |
| **Time Granularity** | Month |
| **Date Range** | Last 6 months |
| **Value Representation** | Percentage |
#### What the Cohort Reveals
{/* TODO: Replace with screenshot of the resulting cohort table — image-20260130-104250.png from source doc */}
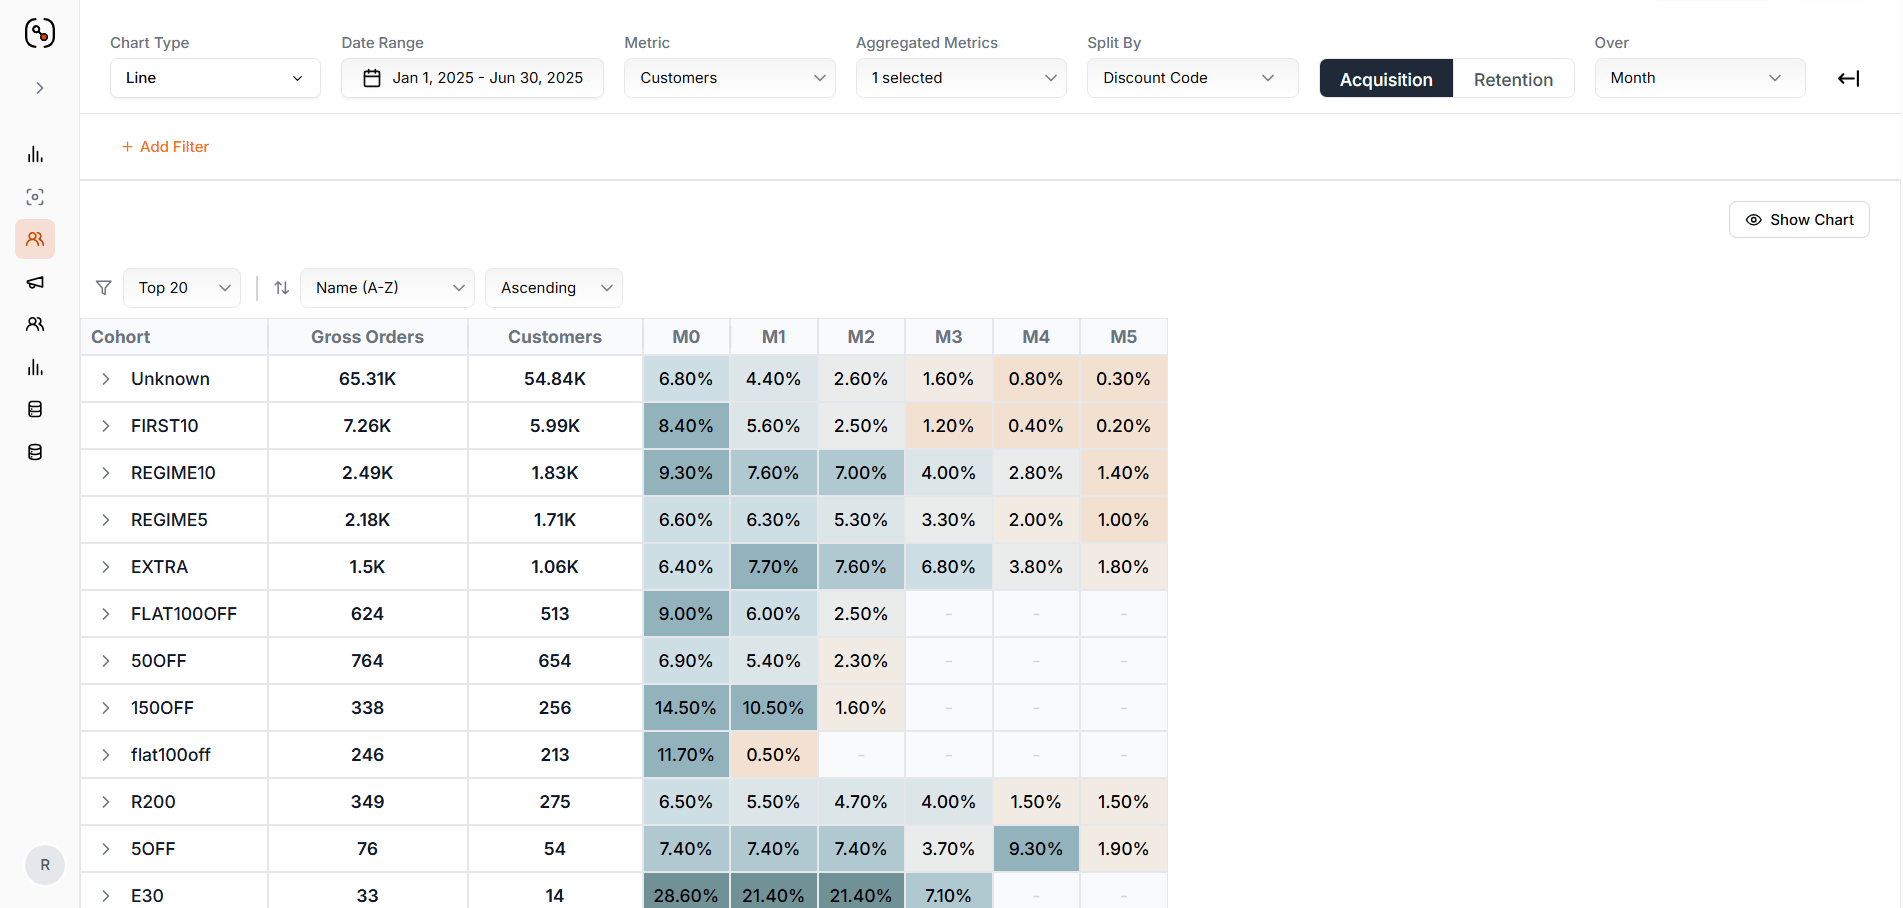 #### Actionable insights by team
**Insights**
* Steep retention cliff between M1–M2 across all cohorts (average 40–60% drop)
* Most customers who don't repurchase by M2 are lost permanently
* `E30` and `1500FF` show strong initial engagement but fail to sustain it
**Actions**
* Launch re-engagement campaigns at Day 45–60:
* Personalised product recommendations based on first purchase
* Limited-time "welcome back" offers (10–15% off)
* Educational content about product benefits/usage
* A/B test win-back messaging at M1 vs M2 to find optimal timing
**Insights**
* `REGIME10` and `EXTRA` cohorts show the best long-term retention (1.40% and 1.80% at M5)
* `E30` cohort has exceptional initial retention (28.60% at M0) but drops to 7.10% by M3
* High-discount cohorts (`1500FF`, `FLAT100OFF`) attract deal-seekers with poor LTV
**Actions**
* **Double down on REGIME10/EXTRA acquisition channels** — these customers stick around
* **Investigate E30 source** — whatever drove this cohort, replicate it but add retention mechanics
* **Reduce budget for high-discount campaigns** (`1500FF`, `FLAT100OFF`) unless the goal is pure volume
* Build lookalike audiences based on `REGIME10` characteristics
## How the Purchase Retention Cohort works
### Feature layout
The Purchase Retention Cohort screen has two parts:
* **Retention Curve** — visual trend at the top
* **Cohort Table** — period-by-period breakdown below
#### Actionable insights by team
**Insights**
* Steep retention cliff between M1–M2 across all cohorts (average 40–60% drop)
* Most customers who don't repurchase by M2 are lost permanently
* `E30` and `1500FF` show strong initial engagement but fail to sustain it
**Actions**
* Launch re-engagement campaigns at Day 45–60:
* Personalised product recommendations based on first purchase
* Limited-time "welcome back" offers (10–15% off)
* Educational content about product benefits/usage
* A/B test win-back messaging at M1 vs M2 to find optimal timing
**Insights**
* `REGIME10` and `EXTRA` cohorts show the best long-term retention (1.40% and 1.80% at M5)
* `E30` cohort has exceptional initial retention (28.60% at M0) but drops to 7.10% by M3
* High-discount cohorts (`1500FF`, `FLAT100OFF`) attract deal-seekers with poor LTV
**Actions**
* **Double down on REGIME10/EXTRA acquisition channels** — these customers stick around
* **Investigate E30 source** — whatever drove this cohort, replicate it but add retention mechanics
* **Reduce budget for high-discount campaigns** (`1500FF`, `FLAT100OFF`) unless the goal is pure volume
* Build lookalike audiences based on `REGIME10` characteristics
## How the Purchase Retention Cohort works
### Feature layout
The Purchase Retention Cohort screen has two parts:
* **Retention Curve** — visual trend at the top
* **Cohort Table** — period-by-period breakdown below
 ### Visualisation options
* **Chart type:** Line, Area, Bar
* **Number format:** Absolute values or Percentages
### Cohort table — what each column means
| Column | What it shows |
| ---------------------- | ---------------------------------------------------- |
| **A** | Cohort acquisition period (e.g. *Month of Jan 2024*) |
| **B** | Cohort size and aggregated metrics |
| **C - Month 0** | Always 100% |
| **Subsequent columns** | Repeat purchase behaviour over time |
Percentages are rounded to the nearest whole number.
### Defining your analysis - The query bar
The query bar contains everything you need to define what you're measuring and how you're viewing it.
#### 1. Metric selection
The metric is what each cohort cell measures.
| Metric | What it measures | When to use it |
| ---------------------------------- | ------------------------------------------- | ----------------------------------- |
| **Net Orders** | Total orders minus returns/cancellations | Actual fulfilled demand |
| **Gross Orders** | All orders placed | Top-of-funnel volume |
| **Net Revenue** | Revenue after returns/discounts | True revenue impact |
| **Gross Revenue** | Total order value before adjustments | Initial transaction value |
| **Customers** | Unique customers who purchased | Repeat customer count |
| **Accumulated Sales per Customer** | Gross revenue per customer over time | Customer lifetime value progression |
| **Net AOV** | Average net order value | Pricing effectiveness |
| **Gross AOV** | Average gross order value | Initial basket size |
| **Accumulated CM1 per Customer** | Cumulative contribution margin per customer | True profitability per customer |
| **CM1** | Contribution Margin (Revenue − COGS) | Profitability analysis |
#### 2. Aggregated metrics — summary values at a glance
These sit alongside the cohort visualisation as instant health metrics.
| Metric | What it shows | Why it matters |
| ---------------------------- | ------------------------------------------- | ----------------------------- |
| **Repeat Purchase Rate (%)** | % of customers who made 1+ repeat purchases | Your retention litmus test |
| **CAC** | Total acquisition cost | Benchmark against payback |
| **CAC per Customer** | Average cost to acquire each customer | Channel efficiency comparison |
| **Customer LTV** | Total lifetime value per customer | Long-term value creation |
| **CAC Payback** | Time to recover acquisition cost | Cash flow and unit economics |
#### 3. Time and granularity
**Date range:** 7d, 30d, This Month, FYTD, Custom, etc.
This defines your cohort entry point. All customers in your analysis share this acquisition period.
**Granularity:** Day, Week, Month, Quarter, Year.
Start with **Month** for initial exploration. Switch to **Week** if you spot interesting patterns in specific months that need deeper investigation.
#### 4. Split By
Use **Split By** to compare how different segments perform.
**Two split modes** — same data, different pivot:
**Cohort period stays the primary row.** Each cohort month is broken down into nested sub-rows, one per split-by value.
*Example:* Split by Discount Code → expand the **Jan 2024** cohort to see `REGIME10`, `E30`, `1500FF` as nested rows inside it, each with its own retention across M0–M5.
Use when you want to see the segment composition *within* each acquisition period.
**Split-by value becomes the primary row.** Each segment is broken out into its own complete cohort table across cohort months.
*Example:* Split by Discount Code → one cohort row for `REGIME10`, one for `E30`, each showing its full M0 → M5 retention curve.
Use when you want to compare retention curves side-by-side across segments.
**Apply split to Acquisition or Retention:**
* **Acquisition split** - segments customers based on their *first purchase* characteristics.
* *Example:* Split by First Order Category → compare customers who first bought Serums vs. those who first bought Cleansers.
* **Retention split** - segments customers based on their *ongoing purchase* characteristics.
* *Example:* Split by Product Category (retention) → see which categories drive repeat purchases in Month 2, 3, 4…
#### 5. CAC Payback analysis
Enable this to see when your acquisition cost breaks even with customer revenue.
When enabled, the cohort table highlights:
* **Green cells** — cohort period where accumulated revenue surpasses CAC
* **Payback Month indicator** — clear marker showing when ROI turns positive
**Business value:** immediately see if your acquisition strategy is sustainable. If payback takes more than 12 months, cash flow is at risk.
#### 6. Filters - refine your analysis
Sometimes you need to zoom in on specific customer or transaction characteristics.
**Order filters (Acquisition & Retention)** — apply to both the first purchase that brought customers into the cohort *and* subsequent purchases.
Available order filters:
* Product Category, Subcategory, Size, Color, Name, SKU
* Discount Code
* Shipping City, State, Pincode
**Example use case:** *Show me customers who first purchased using discount code `INSTA20` (Acquisition filter) AND whose subsequent purchases included products from the "Serums" category (Retention filter)*. This tells you: are Instagram-acquired customers returning specifically for high-margin serum products?
**Customer filters** - based on customer-level attributes:
* **Most Viewed Category** - what they browsed most
* **First Order Category** - what they actually bought first
* **Lifetime CAC** - how much you spent to acquire them
* Plus any other custom customer attributes in your system
**Example use case:** *Filter to customers with Lifetime CAC > ₹1,000*. This shows whether your high-CAC customers (e.g. from premium channels) actually deliver better retention and LTV — justifying the higher acquisition cost.
#### Filter logic - AND vs OR
Misunderstanding this causes many analysis errors.
| Combination | Logic | Example | Interpretation |
| --------------------------------- | ------- | -------------------------------------------------------------- | ---------------------------------------------------------- |
| **Within the same filter type** | **OR** | Product Category = "Serums" OR "Moisturizers" | Include orders containing Serums OR Moisturizers (or both) |
| **Across different filter types** | **AND** | Product Category = "Serums" AND Shipping State = "Maharashtra" | Include orders that contain Serums AND ship to Maharashtra |
## Tips for analysing purchase retention
### Key interpretation rules
* **A customer belongs to only one acquisition cohort** — based on their first purchase date within your selected date range. A customer in the *Jan 1–7* cohort won't also appear in *Jan 8–15*, even if both cohorts are displayed.
* **A customer can appear in multiple retention periods** — they could make purchases in Month 1, Month 3, and Month 6, appearing in all three retention columns. This is the desired behaviour and indicates strong retention.
* **Percentages are always relative to cohort size**, not the previous period. If Month 0 has 1,000 customers and Month 3 shows 18%, that means 180 customers (18% of the original 1,000) purchased in Month 3 — *not* 18% of Month 2's value.
* **CAC Payback highlights the period when break-even occurs.** Once a cohort cell is marked green, accumulated revenue has surpassed the acquisition cost for that cohort.
### Save a cohort for reuse
You can save a Purchase Retention Cohort configuration to reuse without rebuilding it — essential for monthly reporting, executive dashboards, or ongoing channel performance tracking.
**What gets saved:**
* **Metric and aggregated metrics** — selected cell metric (e.g. Net Revenue) and summary metrics (e.g. Repeat Purchase Rate)
* **Date range and time granularity** — Day, Week, Month, Quarter, or Year
* **Split-by configuration** — split dimension, mode (Breakdown / Breakout), and whether applied to acquisition or retention
* **Value display preference** — Absolute values or Percentage mode
* **CAC Payback setting** — enabled or disabled
* **Order filters** — all product, transaction, and geography filters for both acquisition and retention
* **Customer filters** — any customer attribute filters applied
## Wrap-up
Purchase Retention Cohort turns transaction data into strategic clarity about what drives sustainable revenue growth.
By understanding which customers return, how much they spend over time, when they churn, and which acquisition channels deliver real ROI, you move from guessing to knowing — from spreadsheet analysis to systematic growth strategy.
### Visualisation options
* **Chart type:** Line, Area, Bar
* **Number format:** Absolute values or Percentages
### Cohort table — what each column means
| Column | What it shows |
| ---------------------- | ---------------------------------------------------- |
| **A** | Cohort acquisition period (e.g. *Month of Jan 2024*) |
| **B** | Cohort size and aggregated metrics |
| **C - Month 0** | Always 100% |
| **Subsequent columns** | Repeat purchase behaviour over time |
Percentages are rounded to the nearest whole number.
### Defining your analysis - The query bar
The query bar contains everything you need to define what you're measuring and how you're viewing it.
#### 1. Metric selection
The metric is what each cohort cell measures.
| Metric | What it measures | When to use it |
| ---------------------------------- | ------------------------------------------- | ----------------------------------- |
| **Net Orders** | Total orders minus returns/cancellations | Actual fulfilled demand |
| **Gross Orders** | All orders placed | Top-of-funnel volume |
| **Net Revenue** | Revenue after returns/discounts | True revenue impact |
| **Gross Revenue** | Total order value before adjustments | Initial transaction value |
| **Customers** | Unique customers who purchased | Repeat customer count |
| **Accumulated Sales per Customer** | Gross revenue per customer over time | Customer lifetime value progression |
| **Net AOV** | Average net order value | Pricing effectiveness |
| **Gross AOV** | Average gross order value | Initial basket size |
| **Accumulated CM1 per Customer** | Cumulative contribution margin per customer | True profitability per customer |
| **CM1** | Contribution Margin (Revenue − COGS) | Profitability analysis |
#### 2. Aggregated metrics — summary values at a glance
These sit alongside the cohort visualisation as instant health metrics.
| Metric | What it shows | Why it matters |
| ---------------------------- | ------------------------------------------- | ----------------------------- |
| **Repeat Purchase Rate (%)** | % of customers who made 1+ repeat purchases | Your retention litmus test |
| **CAC** | Total acquisition cost | Benchmark against payback |
| **CAC per Customer** | Average cost to acquire each customer | Channel efficiency comparison |
| **Customer LTV** | Total lifetime value per customer | Long-term value creation |
| **CAC Payback** | Time to recover acquisition cost | Cash flow and unit economics |
#### 3. Time and granularity
**Date range:** 7d, 30d, This Month, FYTD, Custom, etc.
This defines your cohort entry point. All customers in your analysis share this acquisition period.
**Granularity:** Day, Week, Month, Quarter, Year.
Start with **Month** for initial exploration. Switch to **Week** if you spot interesting patterns in specific months that need deeper investigation.
#### 4. Split By
Use **Split By** to compare how different segments perform.
**Two split modes** — same data, different pivot:
**Cohort period stays the primary row.** Each cohort month is broken down into nested sub-rows, one per split-by value.
*Example:* Split by Discount Code → expand the **Jan 2024** cohort to see `REGIME10`, `E30`, `1500FF` as nested rows inside it, each with its own retention across M0–M5.
Use when you want to see the segment composition *within* each acquisition period.
**Split-by value becomes the primary row.** Each segment is broken out into its own complete cohort table across cohort months.
*Example:* Split by Discount Code → one cohort row for `REGIME10`, one for `E30`, each showing its full M0 → M5 retention curve.
Use when you want to compare retention curves side-by-side across segments.
**Apply split to Acquisition or Retention:**
* **Acquisition split** - segments customers based on their *first purchase* characteristics.
* *Example:* Split by First Order Category → compare customers who first bought Serums vs. those who first bought Cleansers.
* **Retention split** - segments customers based on their *ongoing purchase* characteristics.
* *Example:* Split by Product Category (retention) → see which categories drive repeat purchases in Month 2, 3, 4…
#### 5. CAC Payback analysis
Enable this to see when your acquisition cost breaks even with customer revenue.
When enabled, the cohort table highlights:
* **Green cells** — cohort period where accumulated revenue surpasses CAC
* **Payback Month indicator** — clear marker showing when ROI turns positive
**Business value:** immediately see if your acquisition strategy is sustainable. If payback takes more than 12 months, cash flow is at risk.
#### 6. Filters - refine your analysis
Sometimes you need to zoom in on specific customer or transaction characteristics.
**Order filters (Acquisition & Retention)** — apply to both the first purchase that brought customers into the cohort *and* subsequent purchases.
Available order filters:
* Product Category, Subcategory, Size, Color, Name, SKU
* Discount Code
* Shipping City, State, Pincode
**Example use case:** *Show me customers who first purchased using discount code `INSTA20` (Acquisition filter) AND whose subsequent purchases included products from the "Serums" category (Retention filter)*. This tells you: are Instagram-acquired customers returning specifically for high-margin serum products?
**Customer filters** - based on customer-level attributes:
* **Most Viewed Category** - what they browsed most
* **First Order Category** - what they actually bought first
* **Lifetime CAC** - how much you spent to acquire them
* Plus any other custom customer attributes in your system
**Example use case:** *Filter to customers with Lifetime CAC > ₹1,000*. This shows whether your high-CAC customers (e.g. from premium channels) actually deliver better retention and LTV — justifying the higher acquisition cost.
#### Filter logic - AND vs OR
Misunderstanding this causes many analysis errors.
| Combination | Logic | Example | Interpretation |
| --------------------------------- | ------- | -------------------------------------------------------------- | ---------------------------------------------------------- |
| **Within the same filter type** | **OR** | Product Category = "Serums" OR "Moisturizers" | Include orders containing Serums OR Moisturizers (or both) |
| **Across different filter types** | **AND** | Product Category = "Serums" AND Shipping State = "Maharashtra" | Include orders that contain Serums AND ship to Maharashtra |
## Tips for analysing purchase retention
### Key interpretation rules
* **A customer belongs to only one acquisition cohort** — based on their first purchase date within your selected date range. A customer in the *Jan 1–7* cohort won't also appear in *Jan 8–15*, even if both cohorts are displayed.
* **A customer can appear in multiple retention periods** — they could make purchases in Month 1, Month 3, and Month 6, appearing in all three retention columns. This is the desired behaviour and indicates strong retention.
* **Percentages are always relative to cohort size**, not the previous period. If Month 0 has 1,000 customers and Month 3 shows 18%, that means 180 customers (18% of the original 1,000) purchased in Month 3 — *not* 18% of Month 2's value.
* **CAC Payback highlights the period when break-even occurs.** Once a cohort cell is marked green, accumulated revenue has surpassed the acquisition cost for that cohort.
### Save a cohort for reuse
You can save a Purchase Retention Cohort configuration to reuse without rebuilding it — essential for monthly reporting, executive dashboards, or ongoing channel performance tracking.
**What gets saved:**
* **Metric and aggregated metrics** — selected cell metric (e.g. Net Revenue) and summary metrics (e.g. Repeat Purchase Rate)
* **Date range and time granularity** — Day, Week, Month, Quarter, or Year
* **Split-by configuration** — split dimension, mode (Breakdown / Breakout), and whether applied to acquisition or retention
* **Value display preference** — Absolute values or Percentage mode
* **CAC Payback setting** — enabled or disabled
* **Order filters** — all product, transaction, and geography filters for both acquisition and retention
* **Customer filters** — any customer attribute filters applied
## Wrap-up
Purchase Retention Cohort turns transaction data into strategic clarity about what drives sustainable revenue growth.
By understanding which customers return, how much they spend over time, when they churn, and which acquisition channels deliver real ROI, you move from guessing to knowing — from spreadsheet analysis to systematic growth strategy.